Highlighted PR and writing work at the top, social media and design work second, additional writing and video samples next, data analytics projects at the bottom of page
Public Relations & Writing Highlights
Here are some of my favorite samples that demonstrate my ability to produce compelling stories and analysis
Below is a sample press release I created for the announcement of UFC329 using an inverted pyramid style.
Here is sample op-ed that I wrote concerning the Department of Veteran's Affairs and the difficulties many American veterans face.
A slide deck analysis of Disney's crisis response from their major gator attack incident in 2016.
Social Media & Design Samples
Social Media and Creative Work
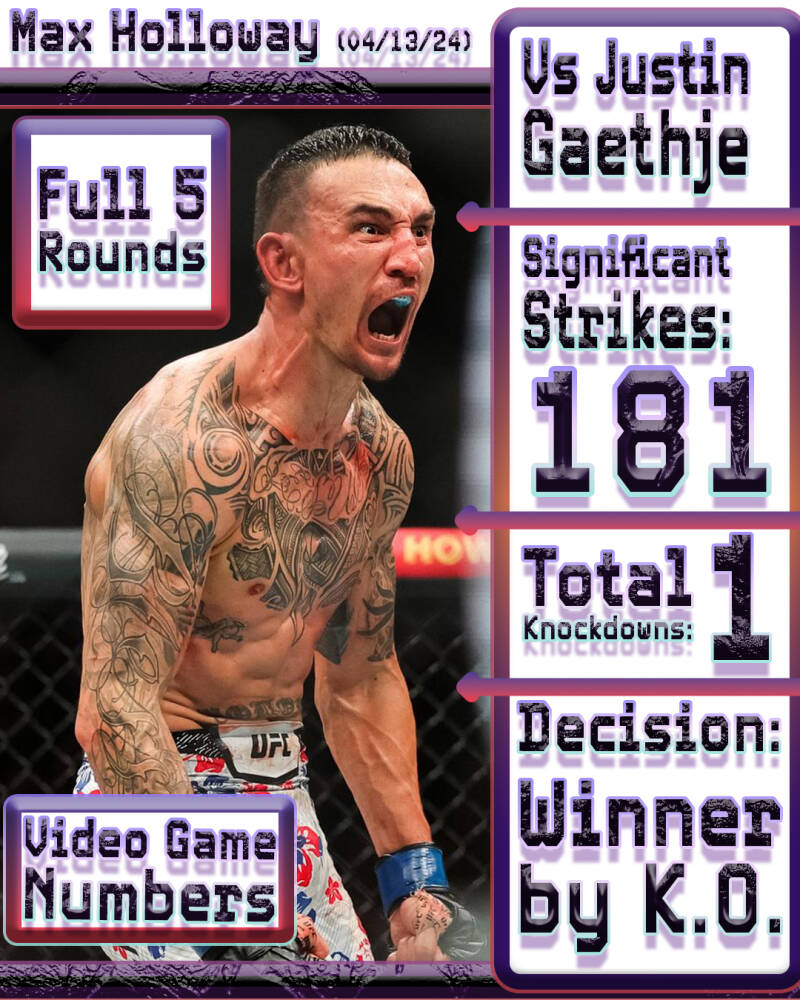
Magazine cover/Instagram post questioning interpretations of analytics

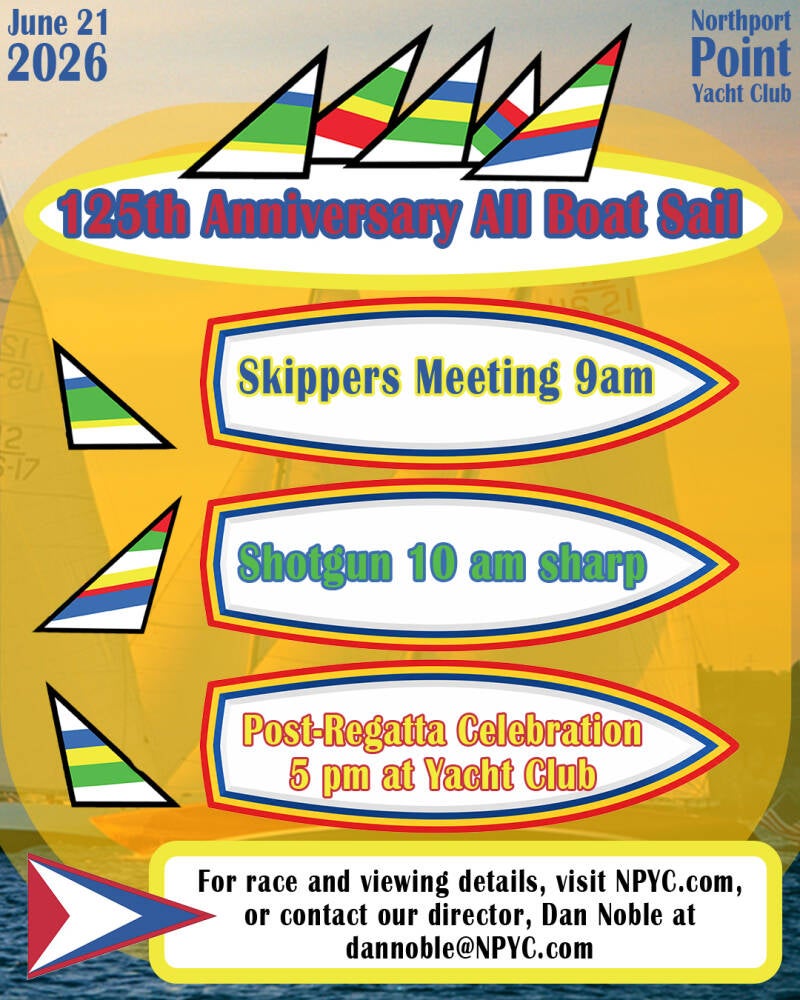
Instagram post/informational flyer highlighting major yacht club event

Logo I designed for my Fraternity Instagram



Pamphlet cover I designed for the 1900s Hisorical US
Additional Writing and Video Samples
Here is a simple design for Mead Garden.
A final evaluation of my campaign working with the Chinese School of Tomorrow to better understand student audiences and target future prospective families.
A brief, simplified review of the economic collapse in 2008 to assist audiences in understanding the failures of prerecession economists and the complexities of modern financial markets
Financial market simulation report.
Research paper regarding the vietnam draft and its psychological effects on young American men.
Longer writing sample about my own interpersonal experiences with my sick father prior to his passing.
Shared campaign where my group and I targeted student audiences through strategic messaging and on-campus engagement to direct attention to the Orlando Union Rescue Mission.
Sample promotional video for Mead Garden and their community events, including testimonial from director.
Interpersonal communication crash course artifact to best engage our college student audience.
Data Analytics Projects & Samples
Here are samples that showcase my analytical abilities and data-driven strategies through data visualization tools such as RStudio, Python, and Power BI
In this semester long macroeconomic analysis of Australia, my team and I took a deep dive into policy decisions through change in fiscal and monetary variables during the years of 1980-2024. This project hinged on my experiences from spending a semester abroad in Australia, and experiencing first hand many of these variables myself. To begin, I looked at GDP growth, inflation, and unemployment through intervals of 10 years, to best visualize the difficulties of stabilization policy in Australia. I then focused the Trade Growth Nexus to best illustrate variable relationships such as the Phillips curve and how imports and exports adjust in response to policy decisions.
In this project, I focused on offensive statistics in baseball, and how baseball managers and front offices should use these statistics to guide their managerial decisions in games and free agency. Through relationships between variables like slugging percentage and on base percentage, I was able to support my hypothesis that teams who consistently favor on base percentage over slugging, will see greater offensive consistency and run support, thus leading to greater regular season and playoff success. I backed up these ideas through visualizing the correlations between these offensive statistics.
This visualization is just a snapshot from my much larger dashboard that allows users to discover the Ski or Snowboard resort that best matches their skills and preferences. The criteria in this dashboard ranges from the off-mountain variables seen in the above screenshot, to price, snow conditions, difficulty, slope maintenance, lift selection, run variety, terrain park size, and more. The interactivity here allows users to select their own experience.
Create Your Own Website With Webador